Learn how to monitor and analyze AI token consumption with Showel
Tracking Token Usage
Learn how to monitor Cursor AI token consumption with Showel's tracking features. This guide covers accessing reports, understanding metrics, and managing project access.
Project Visibility and Access Control
Before tracking usage, ensure your project has access to Showel reports.
Checking Project Access
If you see "Token usage reports are not available for this project" or "AI adoption metrics are currently hidden", your project is not allowed to view Showel data.
To request access:
- Contact your Jira administrator
- Ask them to navigate to Settings > Apps > Showel > Project Visibility
- They can enable access for your project using the toggle or bulk actions
Admin: Granting Project Access
As a Jira administrator:
- Go to Settings (⚙️) > Apps > Showel
- Click Project Visibility in the sidebar
- Find the project in the table (use search if needed)
- Either:
- Use the individual toggle to allow the project
- Select multiple projects and click Allow Selected
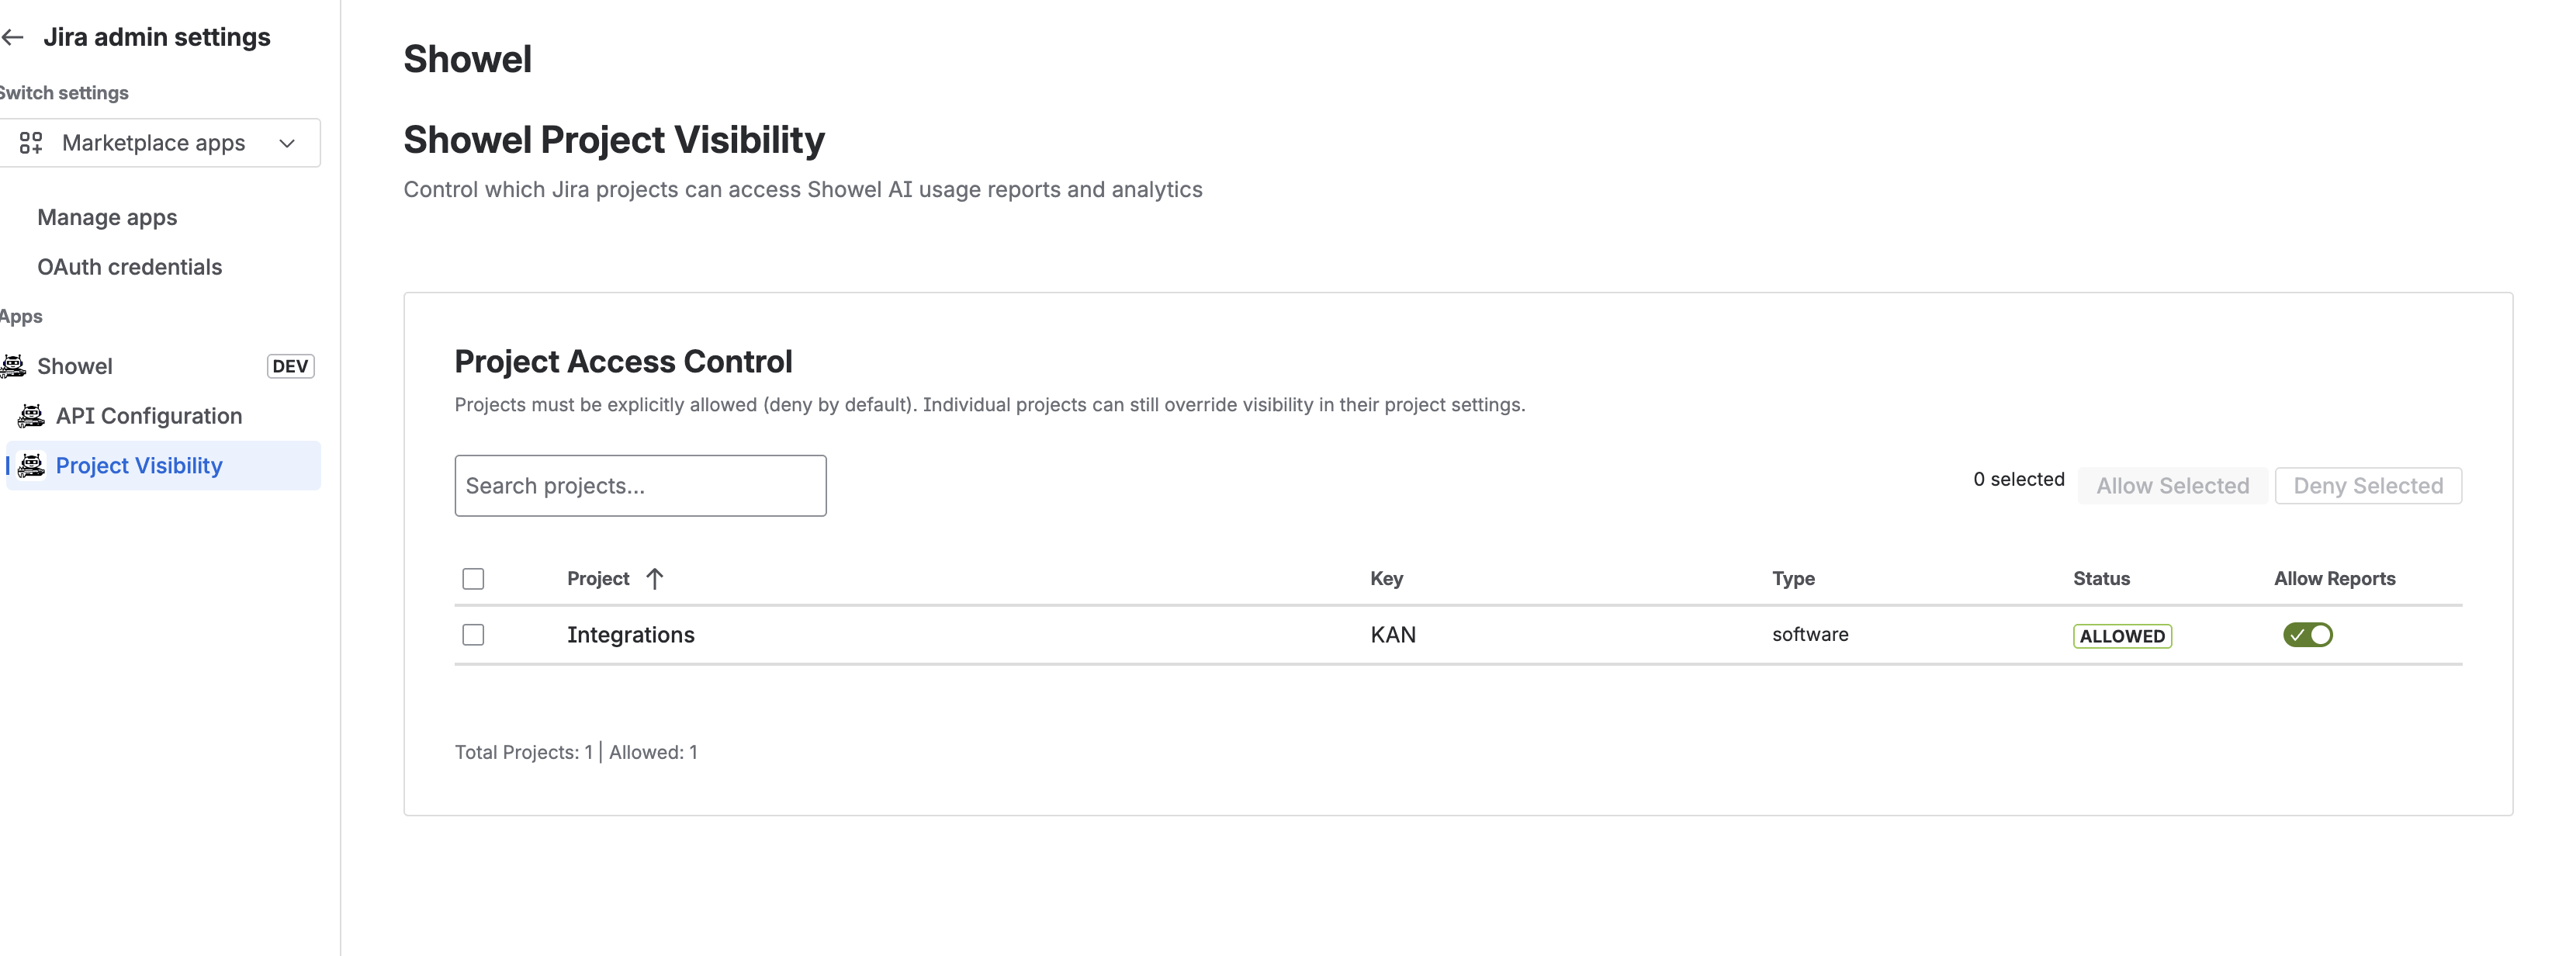 Project Visibility Management
Granting project access to Showel reports
Project Visibility Management
Granting project access to Showel reports
Security Note: Projects are denied by default. Only explicitly allowed projects can view token usage and AI adoption data.
Understanding Token Tracking
What are Tokens?
Tokens are the fundamental units of AI model usage:
- Input tokens - Text sent to the AI model (code context)
- Output tokens - Text generated by the AI (completions, suggestions)
- Total tokens - Sum of input and output tokens
Example: A typical code completion might use:
- Input: 150 tokens (your code context)
- Output: 50 tokens (generated code)
- Total: 200 tokens
How Showel Tracks Tokens
Showel integrates with the Cursor Admin API to:
- Fetch usage data - Retrieves data from Cursor on-demand
- Aggregate by developer - Shows per-team-member consumption
- Access historical data - Up to 90 days (Cursor API limit)
- Display analytics - Charts, trends, and breakdowns
Note: Showel does not store usage data. All data is fetched live from Cursor when you view reports.
Viewing Token Usage Reports
Token Usage Report Page
Access detailed token consumption data:
- Navigate to any allowed project in Jira
- Click Token Usage Report in the project sidebar
- View team member breakdown and analytics
What you'll see:
- Team member table - Token usage per developer with role and email
- Daily usage chart - Line chart showing consumption over time (7 or 30 days)
- Language breakdown - Pie chart showing token usage by programming language
- Model usage - Pie chart showing distribution across AI models
Date range options:
- Last 7 days
- Last 30 days (default)
Each chart has independent date range controls, so you can view different time periods for different metrics.
Viewing AI Adoption Analytics
AI Adoption Analytics Page
Understand your team's AI adoption patterns:
- Navigate to any allowed project
- Click AI Adoption Analytics in the project settings
- Review adoption metrics and developer breakdown
Key metrics:
- Usage Percentage - % of team members actively using AI
- Token Efficiency - Average tokens per active developer
- Acceptance Rate - % of AI suggestions that are accepted
Visualizations:
- Active users over time - Adoption trend chart
- Top programming languages - Most-used languages
- AI models used - Distribution of model usage
Developer Breakdown Table:
Shows per-developer metrics including:
- Total tokens used
- Active days
- Acceptance rate
- Usage trends
Configuration Tab
The Configuration tab allows you to:
- Toggle visibility - Show/hide AI adoption metrics for the project
- Refresh cache - Force refresh of cached data from Cursor API
Understanding the Data
Data Source
All data comes from the Cursor Admin API:
- Team members - Synced from your Cursor account
- Usage data - Daily usage statistics, filtered events, spending data
- 90-day limit - Maximum historical range provided by Cursor API
Data Freshness
- Real-time fetching - Data is fetched when you load the page
- No caching - Data is not stored in Jira (except temporary session cache)
- Cursor sync - Reflects your current Cursor team and usage
Metrics Explained
Token consumption:
- Includes all Cursor AI interactions (completions, chat, refactoring)
- Measured in tokens (text chunks processed by the AI model)
Active developers:
- Team members who have used Cursor AI in the selected time period
- Based on non-zero token consumption
Acceptance rate:
- Percentage of AI suggestions that were accepted/used
- Higher rate indicates more useful suggestions
Best Practices
Regular Monitoring
Establish a review routine:
- Weekly check - Review AI Adoption Analytics to track team adoption
- Monitor trends - Check daily usage charts for patterns
- Review language breakdown - Understand which codebases consume most tokens
Managing Access
Control who can view analytics:
- Start small - Allow access to a few key projects first
- Expand gradually - Add more projects as needed
- Use bulk actions - Efficiently manage multiple projects at once
- Regular audits - Review which projects have access periodically
Understanding Patterns
Look for:
- Adoption trends - Is AI usage increasing or decreasing?
- Language patterns - Which languages benefit most from AI assistance?
- Team engagement - What percentage of developers actively use AI?
Troubleshooting
Missing Data
If usage data isn't appearing:
- Check API configuration - Go to Settings > Apps > Showel > API Configuration
- Test connection - Click "Test Connection" to verify API access
- Verify API key - Ensure your Cursor Admin API key is valid
- Check project access - Confirm the project is allowed in Project Visibility
"Reports Not Available" Message
If you see this message:
- Contact admin - Ask your Jira admin to grant project access
- Check permissions - Verify you have access to the project itself
- Verify configuration - Ensure Showel is configured with valid API credentials
Slow Loading
If reports load slowly:
- Reduce date range - Try 7 days instead of 30 days
- Check Cursor API - Verify Cursor API is responding normally
- Browser refresh - Clear browser cache and reload
Next Steps
- Features Overview - Explore all Showel capabilities
- Quick Start - Get started in 5 minutes
- Installation - Setup instructions
Need help? Contact support@showel.ai or visit the Atlassian Marketplace.
Last updated: 1/20/2026