How to Analyze AI Tokens Across Your Team with Showel
Step-by-step guide to tracking, visualizing, and optimizing Cursor AI token consumption per developer, per project, and per model — directly in Jira.
AI coding assistants have quietly become a significant line item in engineering budgets. Cursor, GitHub Copilot, Claude, and ChatGPT are now standard tools for many development teams — but without visibility into how much each developer or project consumes, costs can spiral before anyone notices.
This guide walks you through how to use Showel to get clear, actionable visibility into AI token usage across your team, directly inside Jira.
What Is a Token, and Why Does It Matter?
Before diving into the tooling, it helps to understand what you're actually measuring.
Every request to an AI model is measured in tokens — roughly 4 characters or ¾ of a word. A typical code-completion request might involve:
- 150 input tokens: the context your editor sends (open files, cursor position, comments)
- 50 output tokens: the suggestion the model returns
- 200 total tokens: what you're billed for
Multiply that across 20 developers making 50–100 completions a day, and you're looking at millions of tokens per week. The dollar cost depends on the model tier — Cursor's premium models (Claude Sonnet, GPT-4o) cost significantly more than the default fast model.
The problem isn't the cost itself. The problem is not knowing where it's going.
Where Showel Gets Its Data
Showel connects to the Cursor Admin API using credentials you provide. It fetches token usage data live — no intermediate storage on our servers. The API provides a 90-day rolling window of team usage.
The data is accessed within your Jira Cloud instance via the Atlassian Forge platform. Showel never reads your code, prompts, or AI responses — only usage counts and metadata. See our privacy policy for full details.
Setting Up Showel
If you haven't installed Showel yet, start with the installation guide. The short version:
- Install Showel from the Atlassian Marketplace
- Open the Showel admin page in your Jira instance
- Enter your Cursor Admin API key
- Grant access to the projects you want to monitor
The quick start guide walks you through each step in under 5 minutes.
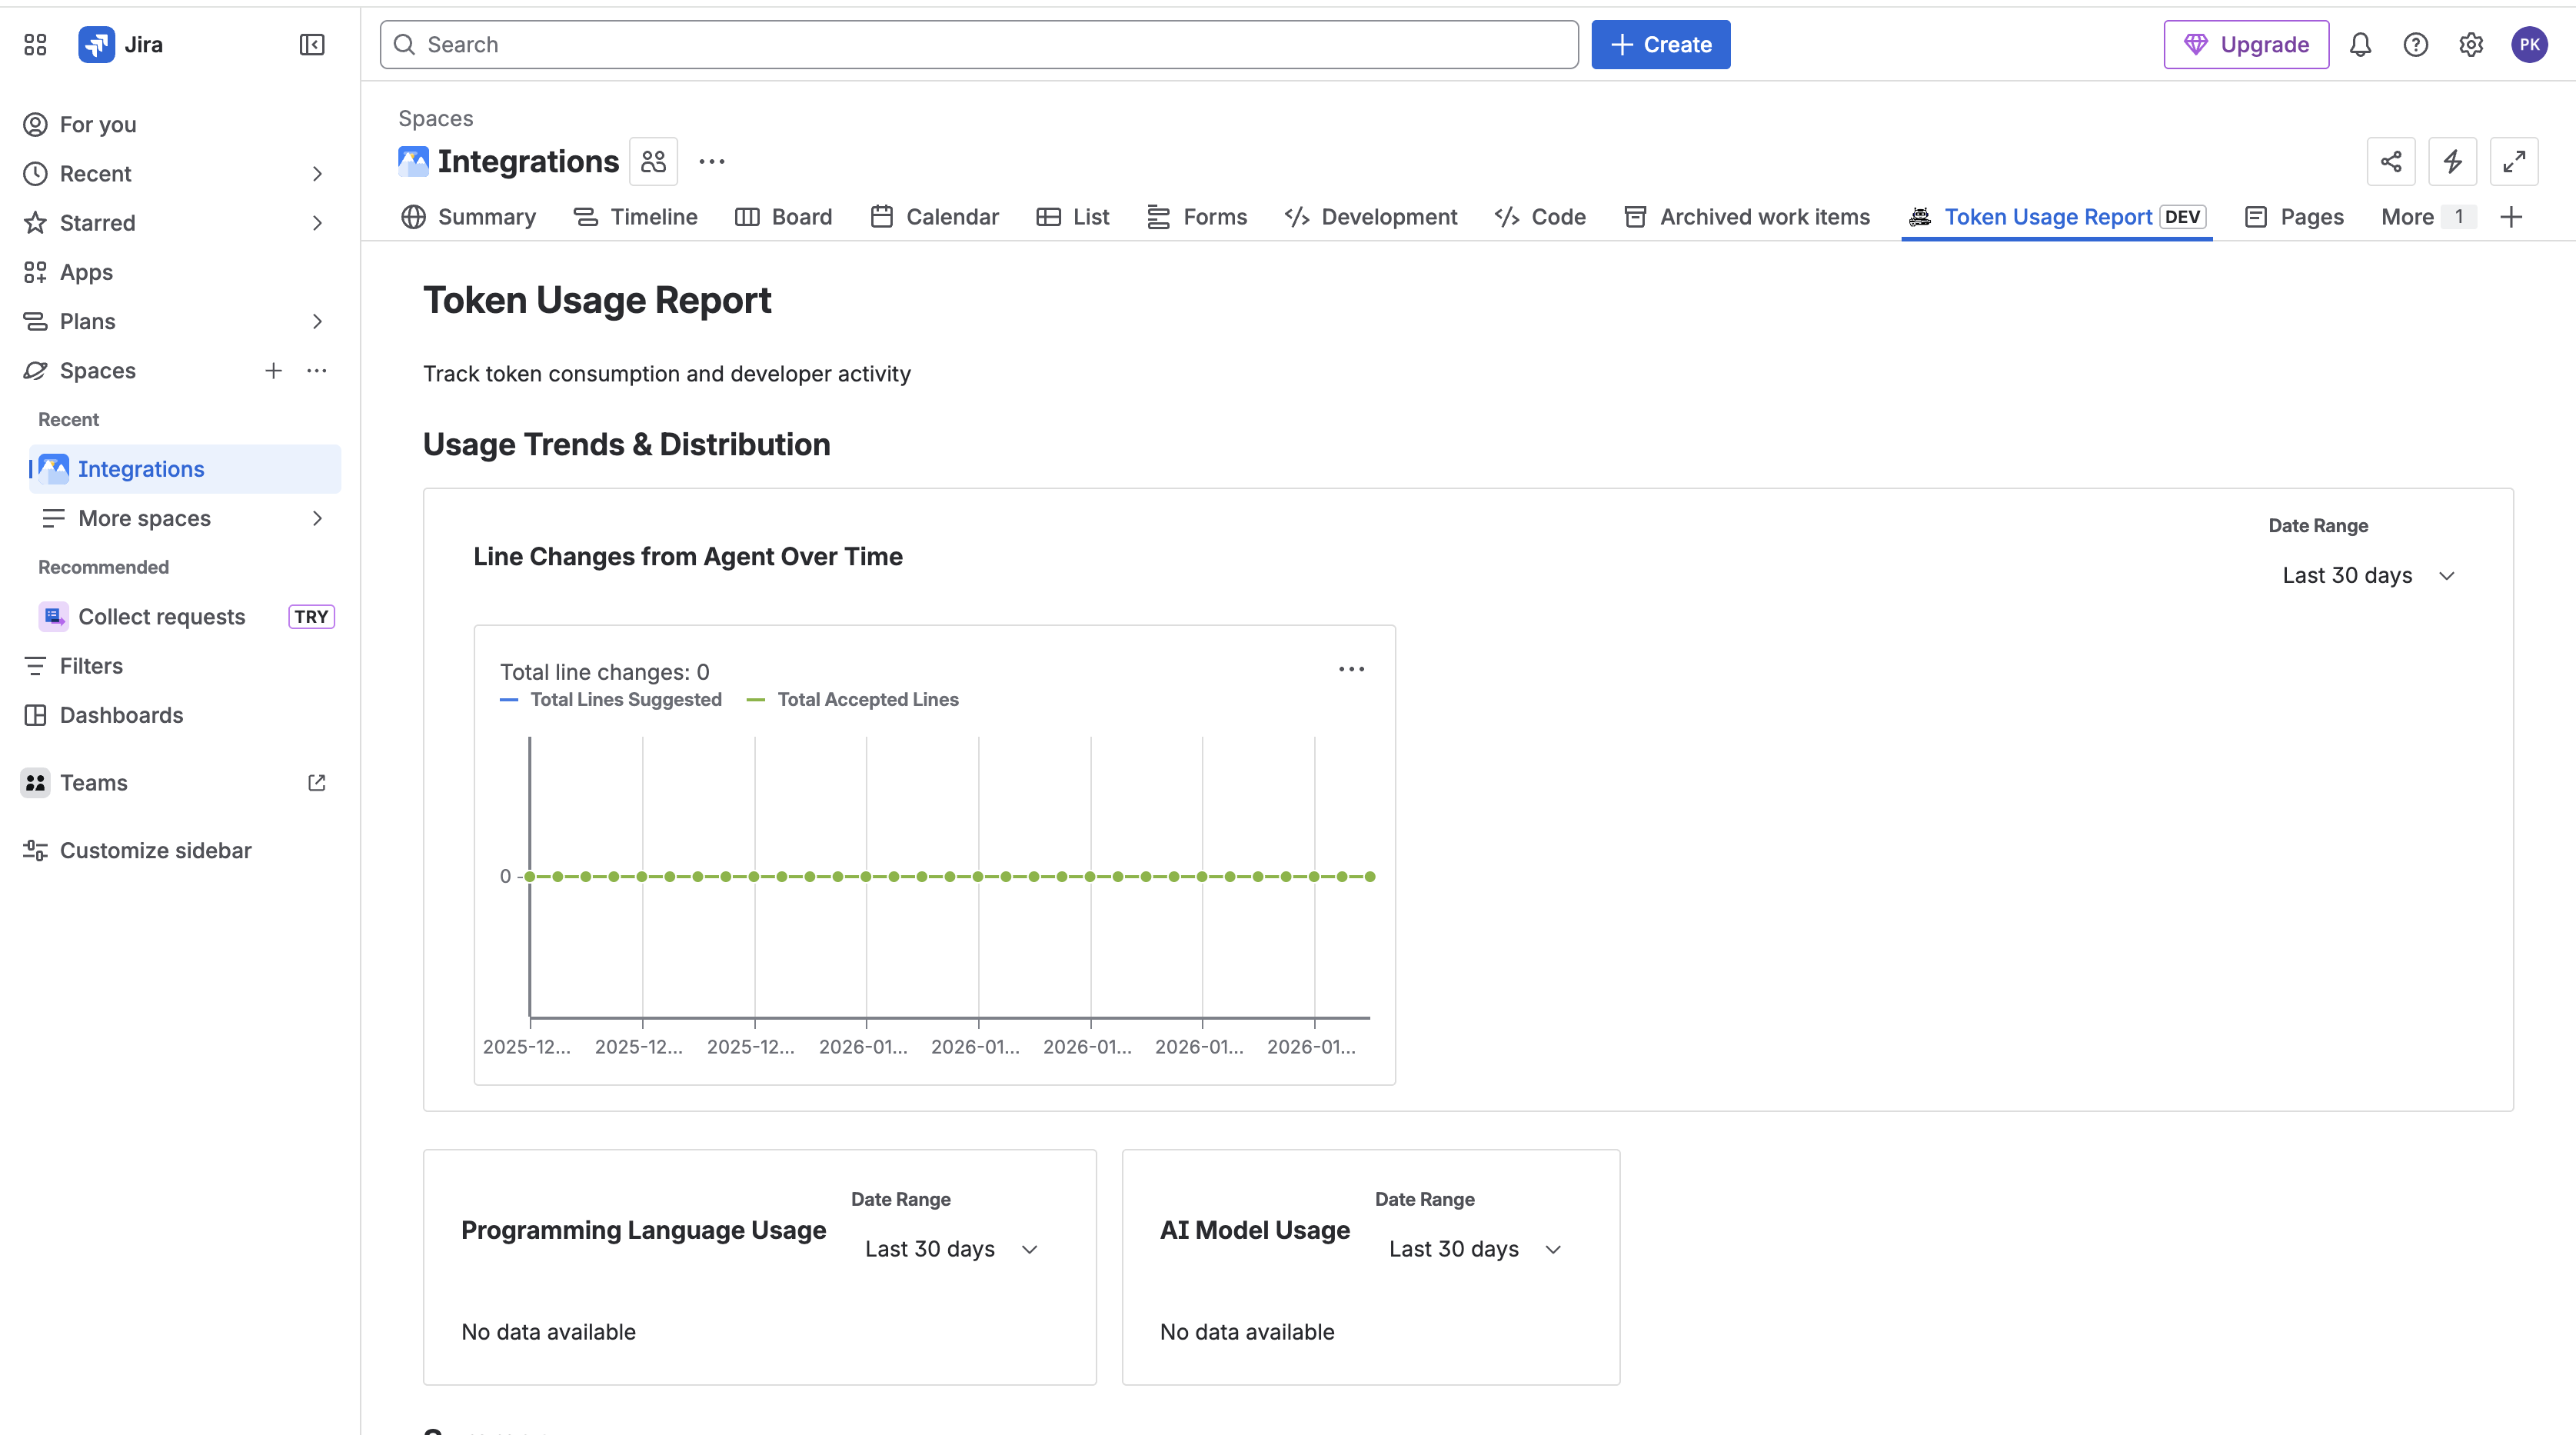
The Token Usage Report
Once configured, navigate to the Token Usage Report inside any Jira project that has access. This is the main dashboard for token analysis.
Team Member Table
The top section shows a sortable table of every developer on your Cursor team, with columns for:
- Total tokens consumed in the selected date range
- Input vs. output token breakdown
- Active days: how many days they generated at least one completion
- Trend: whether their usage is increasing or decreasing week-over-week
Sorting by "Total tokens" descending immediately tells you who your heaviest consumers are. In most teams, the top 3–4 developers account for 50–60% of total token spend.
Daily Usage Chart
Below the table, a line chart shows total daily token consumption across the team. This is useful for spotting:
- Spikes: A sudden jump on a specific day often correlates with a complex feature, a large refactor, or a new team member onboarding
- Plateaus: Flat usage over several weeks might mean the team isn't getting value from the tool or adoption has stalled
- Trends: A steady upward slope is healthy — it means the team is using AI more as they get comfortable with it
Language Breakdown
A pie chart shows which programming languages generate the most tokens. In most codebases, this closely mirrors where the most active development is happening. If you're surprised by the distribution, it's worth investigating whether certain language-specific configurations are generating excessive context.
Model Breakdown
This chart shows the split between Cursor's model tiers — fast model vs. premium models (Claude Sonnet, GPT-4o, etc.). Premium models produce better results but cost more. If 80% of your tokens are on premium models and your team isn't intentionally choosing them, it's worth reviewing the default model configuration in Cursor.
Drilling Down per Developer
The AI Adoption Analytics section provides a developer-level breakdown. For each team member, you can see:
- Total tokens over the selected period
- Acceptance rate (how often they accept AI suggestions)
- Active days
- Usage trend
The acceptance rate is particularly valuable. A developer with high token consumption but a low acceptance rate is generating a lot of AI suggestions but rejecting most of them. This could mean:
- Their prompting style is inefficient
- They're using AI for tasks where it doesn't perform well
- They could benefit from training or workflow adjustments
Conversely, a high acceptance rate with moderate token consumption is the sweet spot — the developer is getting value without burning tokens unnecessarily.
Common Questions Showel Answers
Who consumed the most tokens this week? Sort the team member table by total tokens, descending.
Which project is driving the most AI usage? Compare Token Usage Reports across projects. Projects with high churn, complex domains, or active refactoring typically show higher usage.
Which languages use the most tokens? Check the language breakdown chart. Context-heavy languages (TypeScript with complex type definitions, Python with long imports) tend to generate more input tokens.
Which model tier dominates? The model breakdown chart tells you immediately. If premium models dominate and budget is a concern, explore setting the default to the fast model for non-critical workflows.
Is AI adoption increasing or flat? The daily usage trend and the per-developer trend column give you a quick answer.
Turning Insights into Action
Data is only useful if it leads to better decisions. Here are the most common actions teams take after reviewing Showel reports:
Tighten context windows: Cursor sends surrounding code as context. If developers have many large files open, this inflates input tokens without improving suggestions. Encourage developers to close unrelated files.
Promote efficient prompting: Developers who ask precise, focused questions get better suggestions with fewer tokens. A brief internal workshop on prompting best practices often reduces token consumption by 15–20% with no loss in productivity.
Right-size Cursor seats: If 30% of your licensed developers show zero usage over 30 days, those are seats you can reclaim. See our developer monitoring guide for a detailed workflow.
Review model defaults: For tasks like documentation, simple autocomplete, or boilerplate generation, the fast model performs comparably to premium models at a fraction of the cost.
Security and Privacy
Showel is purpose-built around a minimal-data principle. The Cursor API exposes usage counts and metadata — not your code or AI conversations. Showel fetches this data live, within Atlassian's Forge infrastructure, and never transmits it to our servers.
Project access is deny-by-default: a project only sees AI usage reports if a Jira admin explicitly grants it access. API credentials are encrypted using Forge's secure storage. Showel requires only read permissions on your Jira instance — it cannot modify any Jira data.
Full details are in our security policy.
Next Steps
- Install Showel from the Atlassian Marketplace — takes under 5 minutes
- Read the Tracking Token Usage guide for advanced filtering and date range options
- Learn how to monitor which developers are actively using your API
- Contact us with questions or feedback — we respond within 24 hours