How to Monitor Which Developers Are Using Your Developer API
A practical guide to tracking per-developer usage of your Cursor Admin API integration — identify active users, detect abandoned seats, and enforce fair-use policies in Jira.
When you give a team access to an AI coding assistant, you expect them to use it. But knowing who is actually using it — and who has quietly stopped — is harder than it sounds.
Cursor's admin dashboard shows aggregate usage data, but mapping that back to individual developers, understanding usage patterns, and presenting it in the context of your project work requires another layer of tooling. That's exactly what Showel provides.
This guide explains how to monitor per-developer API usage through the Showel Jira plugin — who's active, who's drifted away, and how to act on what you find.
Why Developer-Level API Monitoring Matters
Most engineering leaders who adopt AI coding tools focus on the top-line metric: total tokens consumed, total cost per month. That's a start, but it misses the operational details that actually affect ROI:
Licensing cost vs. actual use. If you're paying for 25 Cursor seats but only 15 developers have used the tool in the last 30 days, you're over-licensed. Seat reclamation alone can reduce AI tooling costs by 20–30% in teams where adoption is uneven.
Security and access control. When a developer leaves the company, their Cursor account should be deactivated promptly. Monitoring per-developer API usage makes it easy to spot accounts that remain active after someone has offboarded.
Adoption vs. churn. A developer who used the tool heavily for two weeks and then stopped is a different problem than one who never started. The former is a retention and workflow issue; the latter is an onboarding issue. Treating them the same leads to bad interventions.
Training ROI. If you run a prompting workshop or add a Cursor configuration to a project, you want to know whether usage improved for the participants.
How Showel Maps API Usage to Real Developers
Showel pulls team member data directly from the Cursor Admin API using the credentials you configure. It cross-references Cursor user identifiers with Jira user accounts, giving you a single view of AI usage per developer — inside the Jira workspace where you already track their work.
The data is fetched live. Showel does not store a copy of your usage data on our servers — it reads from the Cursor API at report time and displays the results within your Jira instance via Atlassian Forge. See the privacy policy for the full architecture.
The Cursor API provides a 90-day rolling window of per-user usage data, refreshed on each report view.
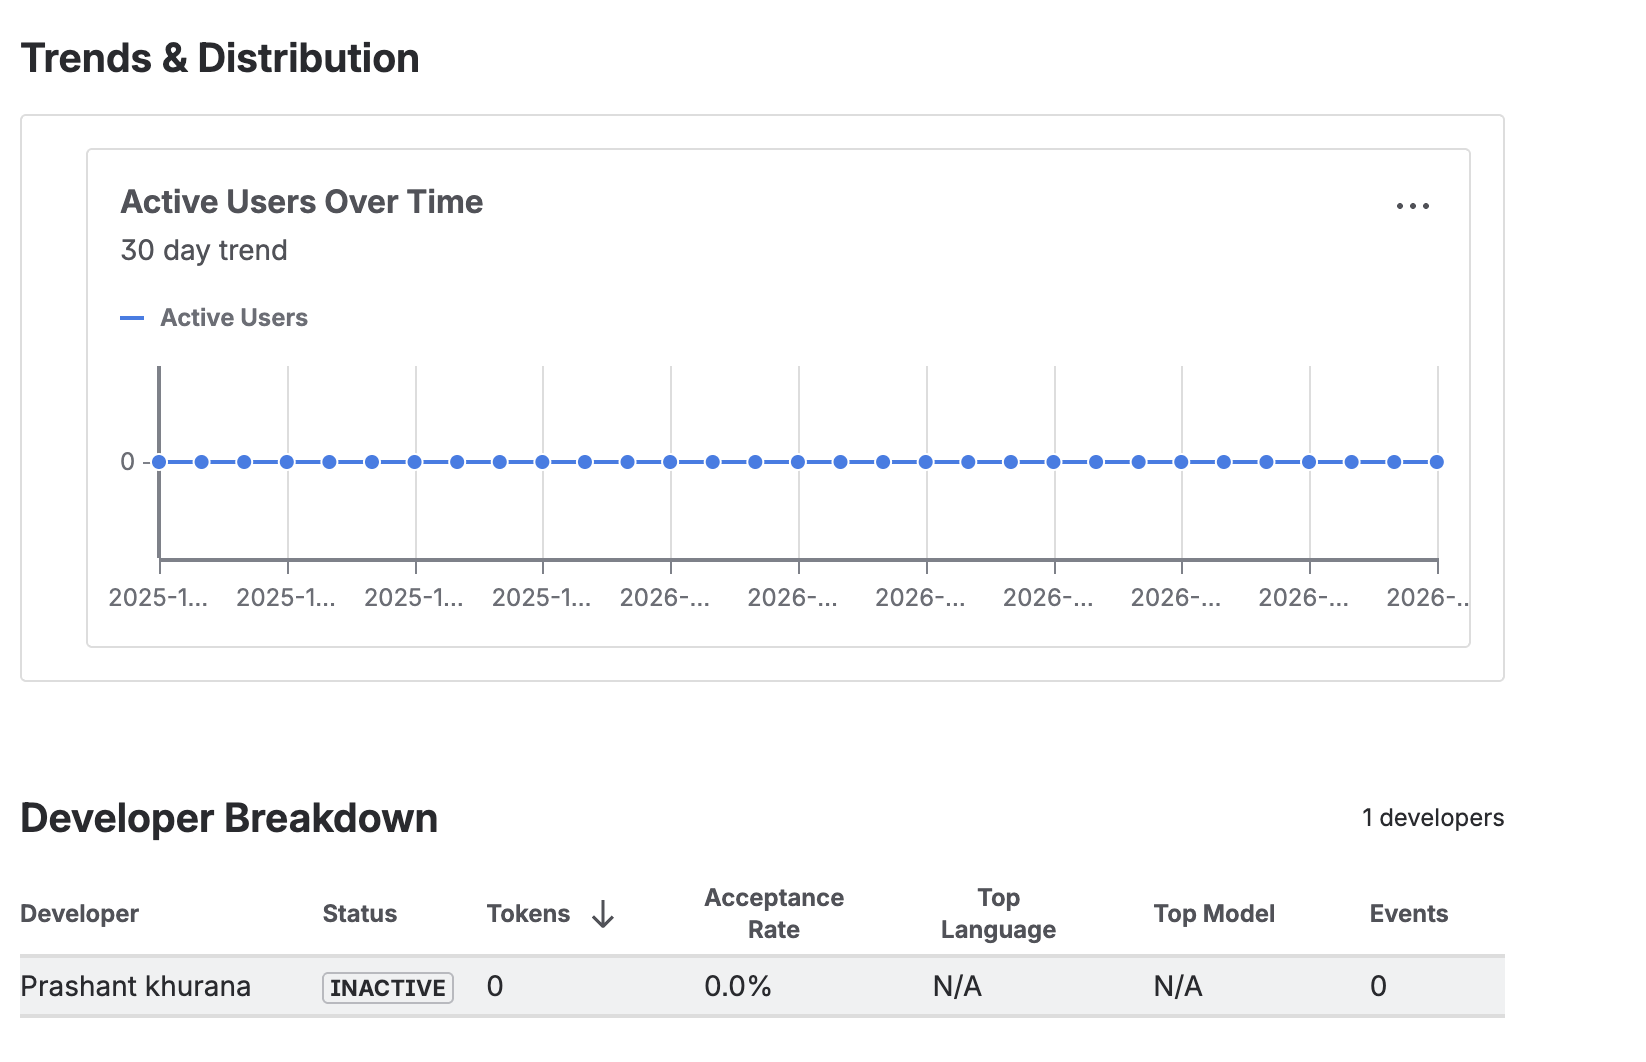
The Developer Breakdown View
Navigate to AI Adoption Analytics inside any Jira project that has been granted report access by your Jira admin. The Developer Breakdown table is the primary tool for per-developer monitoring.
Each row represents one developer on your Cursor team. The columns are:
Total tokens: The cumulative token consumption for the selected date range. This is the sum of input tokens (context sent to the model) plus output tokens (suggestions returned). It's your primary usage signal.
Active days: The number of distinct days the developer generated at least one AI completion. A developer can have a high total token count with few active days (heavy burst usage) or a lower token count spread across many active days (consistent daily use). Both patterns are healthy — what you're looking for is zero active days.
Acceptance rate: The proportion of AI suggestions the developer accepted vs. dismissed. High acceptance rates (above 30%) indicate the developer is getting useful suggestions. Rates below 10% suggest the workflow isn't clicking — the model's suggestions aren't relevant to their work, or they haven't configured their context well.
Usage trend: A directional indicator showing whether the developer's usage is increasing, flat, or declining compared to the previous equivalent period. A declining trend for a previously active user is a signal worth investigating.
Reading the Signals
Active Users
Developers with non-zero token consumption and multiple active days in the past 30 days are your healthy adoption cases. These users are getting value from the tool and don't need intervention.
For active users, the interesting questions are:
- Is their acceptance rate in a reasonable range?
- Are they using premium models when the fast model would suffice?
- Is their usage trending up (growing proficiency) or plateauing?
Inactive Seats (Zero Tokens Over 30 Days)
This is the most actionable category. A developer with a Cursor seat who hasn't generated a single token in 30 days is a seat you're paying for with zero return.
Before reclaiming the seat, it's worth a quick conversation. Common explanations:
- The developer recently joined and hasn't onboarded yet
- They switched to a different project that doesn't require much AI assistance
- They had a negative early experience and quietly stopped using the tool
If none of these apply and the seat has been inactive for 60+ days, it's a strong candidate for reclamation.
Heavy Users
Developers in the top decile of token consumption warrant attention, but not necessarily concern. In most teams, the highest token consumers are also the most productive users — they've integrated AI deeply into their workflow.
The question to ask is: is their acceptance rate commensurate with their consumption? A developer consuming 5x the team average with a 35% acceptance rate is likely doing something right. The same consumption with a 5% acceptance rate suggests inefficiency in how they're prompting the model or how their editor context is configured.
Low Acceptance, High Consumption
This pattern — many tokens consumed, few suggestions accepted — is worth coaching. It typically indicates:
- The developer is using AI for tasks where the model struggles (highly domain-specific code, unusual frameworks, very long context windows)
- Their Cursor configuration isn't optimized for their codebase
- They haven't developed effective prompting habits
A 30-minute session reviewing their workflow and configuration usually moves the needle significantly.
Data Freshness and the 90-Day Window
The Cursor Admin API provides usage data for the last 90 days. Showel fetches this data live each time a report is viewed — there's no local cache or stored copy.
This means:
- Reports are always current as of the last Cursor API refresh (typically near real-time)
- Historical data beyond 90 days is not available through Showel
- Spot checks work well — viewing the report on demand gives you a current snapshot
For monthly reviews, we recommend viewing the report on the same day each month and noting the key metrics. If you need a longitudinal record, export the developer table manually at each review cycle.
Setting Up Project-Level Access Control
Before any project can view AI usage reports, a Jira admin must explicitly grant it access. This is Showel's deny-by-default security model.
To configure project access:
- Open the Showel admin page in your Jira instance
- Navigate to Project Visibility
- Toggle on the projects that should have access to usage reports
- Only members of those projects can view their project's AI usage data
This means a developer in Project A cannot see usage data for Project B, even if they're on the same Cursor team. Jira project permissions are the access boundary.
See the tracking usage guide for the full configuration walkthrough.
Sample Workflows
Monthly Seat Review
Once a month, a Jira admin or engineering manager opens the AI Adoption Analytics report with a 30-day date range. They export or note:
- Developers with zero active days → candidates for a conversation or seat reclamation
- Developers with declining trends → candidates for check-in on workflow friction
- Developers with low acceptance rates → candidates for a prompting coaching session
- Top consumers with high acceptance rates → consider for internal showcases or documentation of their workflow
This review takes 15–20 minutes and surfaces the decisions that matter.
Quarterly Adoption Readout
For leadership reporting, open the report with a 90-day range and capture:
- Month-over-month trend in total team token consumption
- Number of developers with at least 10 active days in the quarter
- Acceptance rate distribution across the team
- Model tier split (fast vs. premium)
These four metrics tell a concise adoption story without requiring the audience to understand token economics in detail.
Post-Onboarding Check
When a new developer joins and is given a Cursor seat, schedule a 14-day check using Showel. If their active day count is still zero at day 14, something went wrong in the onboarding — follow up before the habit window closes.
Privacy: What Showel Sees (and Doesn't See)
Monitoring developer usage raises a natural question: how much visibility does this give you into someone's work?
The answer is intentionally limited. Showel shows:
- How many tokens a developer consumed
- How many days they were active
- Whether they accepted or dismissed suggestions (aggregate rate, not individual suggestions)
- Which model tier they used
Showel does not show:
- The code a developer wrote or edited
- The prompts they sent to the AI
- The suggestions the AI returned
- Jira issue content or descriptions
The Cursor API itself doesn't expose code or conversation content — only usage metadata. Showel operates on that metadata layer. See our privacy policy for the complete picture.
Next Steps
- Install Showel from the Atlassian Marketplace if you haven't already
- Follow the quick start guide to connect your Cursor API credentials
- Read the features overview to understand the full report suite
- See how to analyze AI tokens across the team for the token usage deep-dive
- Contact us with questions — we're happy to walk through your specific monitoring use case